Chemically characterise your coatings with Renishaw’s inVia confocal Raman microscope. It is the next-generation system for a variety of studies ranging from fundamental materials research through to quality control and failure analysis of end products.
Figure 1. The Renishaw inVia confocal Raman microscope
The inVia confocal Raman microscope provides the following benefits:
- Explicit identification of all types of materials - inorganic, organic, amorphous, crystalline, liquids, and solids including allotrope/polytype differentiation
- Data about a material’s spatial distribution through 2D and 3D maps and depth profiles
- Resolves sub-micrometer features
- Applicable for in situ and ex situ measurements
- Maps rough, curved, and irregular rough surfaces
- Automatically maintains focus and obtains excellent data from coatings as they contract or expand during curing and interaction with the environment
- Employs a non-contacting, non-destructive method
- Inorganic and polymer material (and other) spectral databases are available
- Analyzes unknown materials with multivariate statistical algorithms
- Results can be quantified with metrics, such as particle statistics and fraction estimates
Coatings on Steel
The inVia confocal Raman microscope can be utlized on different types of coatings and paints, and this specific example will demonstrate its use to analyze coatings applied to zinc-coated steel.
The sample included paint (about 20 µm) and primer (about 10 µm) layers that were applied to zinc and sectioned using ion-beam milling before doing the analysis with the inVia confocal Raman microscope. It was possible to view the particles within the paint layer.
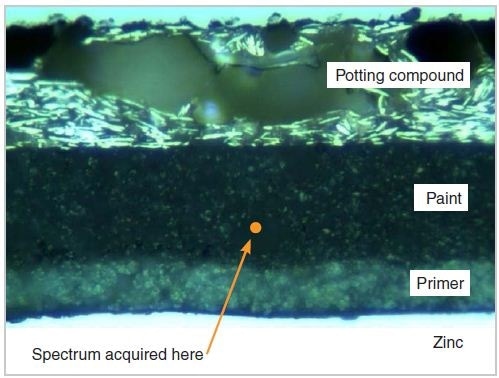
Figure 2. Optical micrograph of the sample. The orange dot indicates the location of the particle that was analyzed.
Analysis of a Particle Within the Paint Layer
The optical micrograph shows particles that are visible within the paint layer. One particle was analyzed with a Raman point measurement. The inVia microscope has high confocality, so the resulting spectrum was mostly obtained from the additive, without any major contributions from the surrounding paint.
The spectrum was then compared against entries from the Renishaw spectral database of polymers and was observed to most closely match phthalates, especially a common plasticizer called poly(diallyl isophthalate), DAIP (Figure 3).
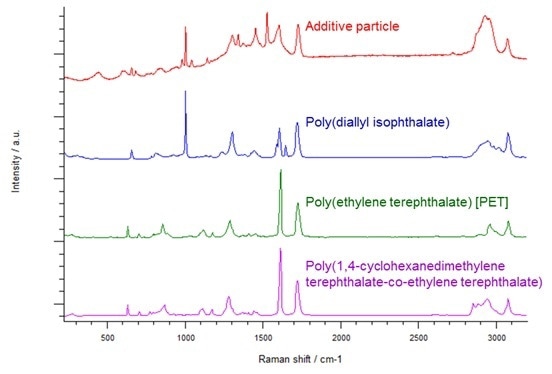
Figure 3. Comparison of the spectrum of the particle against the top three matching spectra from the Renishaw spectral database of polymers.
Chemical Mapping of the Primer
The constituents of the primer layer were also examined (Figure 4). Using a 0.2 µm step size, a region of 12 × 40 µm was mapped. The map was analyzed using principle component analysis, where the data are decomposed automatically into clear components (Figure 5).
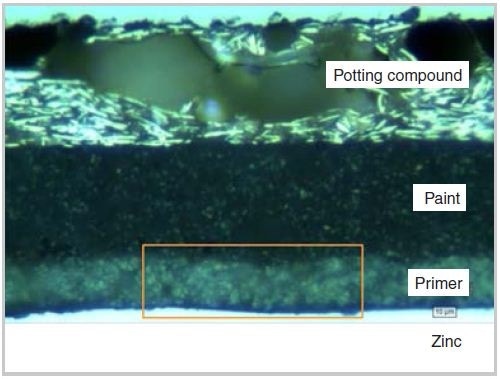
Figure 4. The region analyzed by Raman mapping. The orange box indicates the region 12 × 40µm that was mapped at 0.2µm step size.
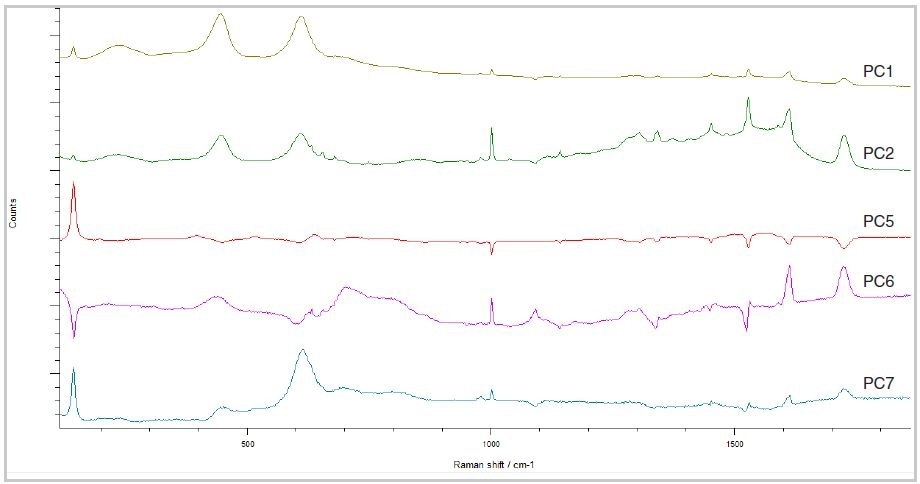
Figure 5. Principle component analysis of the mapped primer region. PC1 is the first component (the most significant), PC7 the least significant.
The following principle components were detected:
| Component |
Color coding |
Identification |
| PC1 |
Yellow |
TiO2 (rutile) |
| PC2 |
Green |
Phthalate polymer |
| PC5 |
Red |
TiO2 (ranatase) |
| PC6 |
Magenta |
Phthalate polymer |
| PC7 |
Cyan |
Carbonate |
The next step was to generate an image, where the components were coded by color. The image provides information about the distribution of materials. It is possible to compare the image with features that were detected in the optical micrograph.
The image results (Figure 6) suggest that the phthalate polymer (magenta) is predominantly present in the paint layer, while the other phthalate polymer (green) is present in both the primer and the paint.
The TiO2 (yellow/red) is largely present in the primer, and the carbonate (cyan) is observed at the interface between the primer and the metal, which is probably zinc carbonate (ZnCO3). This thin layer (less than 0.5 µm) was only detected due to the high sensitivity and high spatial resolution of inVia.
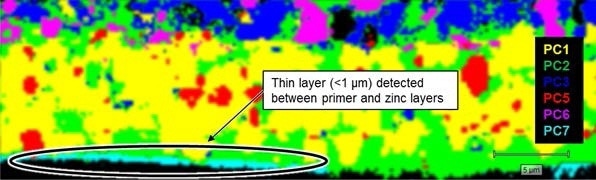
Figure 6. Raman image of the primer layer. Principal component 7 corresponds to a thin layer between the primer and zinc coating (visible inside the black oval).
Particle Size Statistics
inVia is equipped with WiRE software (Windows-based Raman Environment), which has extensive particle statistics capabilities. Using this software, the anatase TiO2 in the primer was analyzed (Figure 7).
A binarized image was generated using direct classical least squares (DCLS) to locate the anatase, followed by identifying the particles and performing the size analysis. The results revealed that the particle size is relatively small, with a mean equivalent circle diameter of 0.9 µm.
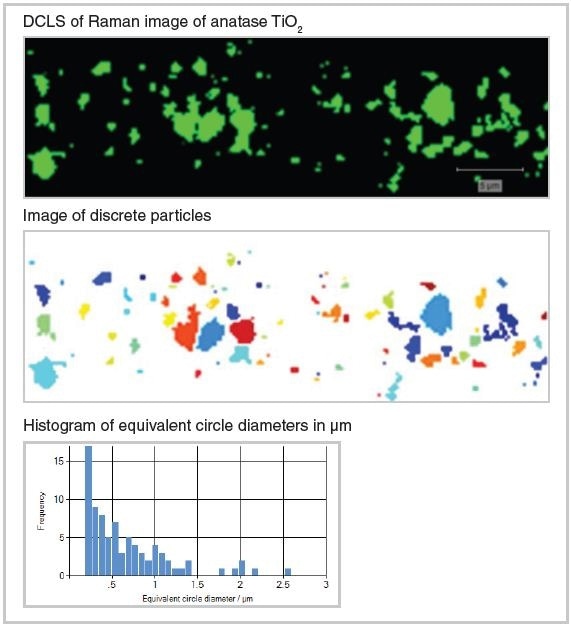
Figure 7. Particle size analysis of the anatase in the primer. The image of the location of the anatase (top) is resolved into discrete particles (middle). These are then used to generate a histogram of size (bottom).
Key Features of inVia Confocal Raman Microscope
The results show that Renishaw’s inVia confocal Raman microscope is a comprehensive analysis tool that enables the analysis of paints and coatings.
The following are the key features of this research grade Raman microscope:
- High sensitivity to determine trace amounts of material
- High spatial resolution to explore small details
- A variety of rapid mapping and imaging solutions capable of mapping uneven, curved, and rough surfaces
- Availability of polymer and inorganic material (and other) spectral databases
- It is possible to quantify results with metrics, such as particle statistics and fraction estimates

This information has been sourced, reviewed and adapted from materials provided by Renishaw plc.
For more information on this source, please visit Renishaw plc.